Calculating Cap Rate for Rental Property Made Simple
A practical guide to calculating cap rate for rental property. Learn to evaluate investments and analyze returns with real-world examples and expert tips.
By James Le
Calculating the cap rate for a rental property is one of the quickest ways to sanity-check a potential deal before you even think about financing. At its core, the formula is simple: you just divide the property’s Net Operating Income (NOI) by its purchase price. This gives you a clean, unleveraged return percentage.
What Cap Rate Reveals About Your Investment

Before getting bogged down in the numbers, it's crucial to get what the capitalization (cap) rate actually represents. Think of it as a financial snapshot, a quick health check on a rental property's potential.
This single percentage is your best friend when you're comparing different investment opportunities. Why? Because it strips away all the financing details and focuses purely on the property's power to generate income. It puts every property on a level playing field.
Interpreting the Numbers
So, what’s a "good" cap rate? That’s the million-dollar question, and the honest answer is: it depends. The right number is always a reflection of the market, the property type, and your own comfort with risk.
Generally, the cap rate tells a story about the classic trade-off between risk and reward:
- Lower Cap Rates (e.g., 3-5%) usually point to lower-risk, more stable investments. You'll see these in high-demand urban areas with strong tenant pools. Investors are willing to pay a premium for this stability, which pushes the cap rate down.
- Higher Cap Rates (e.g., 8-10%+) can signal a much higher potential return, but that often comes with more risk. This could mean the property is in a less desirable area, it's older and needs more work, or the rental market is volatile.
It’s smart to use the cap rate as a barometer for what the market is thinking. For example, U.S. apartment cap rates swung from over 7% after the Great Financial Crisis to historic lows of 4.1% in recent years, before ticking back up to an average of 5.2%. These shifts show you how broader economic conditions directly impact what a property is worth.
Cap rate is a fundamental metric for assessing a property's performance, but it doesn't tell the whole story. It ignores property appreciation and your specific financing terms. It's a measure of the property's intrinsic profitability, not your specific deal structure.
While the cap rate gives you that quick snapshot, you'll also want to calculate ROI for a complete view of investment value. And for a deeper look at market movements, check out our guide on using predictive analytics in real estate.
Gathering the Right Financial Data

You simply can’t land on a reliable cap rate with fuzzy numbers. Before you even touch the formula, the most critical part of the process is hunting down clean, accurate financial data. This really boils down to two things: a property's total income and its true operating expenses.
Think of it as the foundation of a house. If it's shaky, the whole structure is compromised. Your goal here is to build a rock-solid financial picture from verifiable information, not optimistic guesses.
Identifying All Income Sources
First up, you need to calculate the property's Gross Rental Income (GRI). This starts with the monthly rent roll, but that's rarely the full story. Don't leave money on the table by forgetting to account for all the ancillary income streams.
Your income checklist should include every dollar the property generates:
- Monthly Rent: The total rent collected from all units when fully occupied.
- Parking Fees: Any charges for assigned or covered parking spots.
- Laundry Revenue: Income from coin-operated or card-based laundry machines.
- Pet Fees: Monthly pet rent or any one-time fees.
- Storage Unit Fees: Charges for on-site storage solutions.
Getting this complete income picture is the first step toward finding your Net Operating Income (NOI).
Compiling a Realistic Expense List
Next, it's time to tally up all the legitimate operating expenses. These are the day-to-day costs required to keep the property running and in good shape. Be ruthlessly thorough here, because underestimating costs will give you an inflated cap rate that looks great on paper but falls apart in reality.
To get an accurate NOI, you'll need a clear breakdown of what goes in and what stays out.
Essential Data for Calculating Net Operating Income (NOI)
| Data Point | What to Include | What to Exclude |
|---|---|---|
| Income | Monthly Rents, Parking Fees, Laundry Revenue, Pet Fees, Storage Fees | Security Deposits, One-Time Tenant Charges (e.g., late fees) |
| Operating Expenses | Property Taxes, Insurance, Property Management Fees, Utilities (owner-paid), Repairs & Maintenance, Landscaping, Pest Control | Mortgage Payments (Principal & Interest), Depreciation, Capital Expenditures (CapEx) |
This table clarifies that your NOI should only reflect the property's standalone operational performance.
It's absolutely crucial to also factor in the non-obvious costs. A vacancy allowance (typically 5-8% of GRI) accounts for lost rent when a unit is empty. A capital expenditure (CapEx) reserve (another 2-4%) sets aside funds for major future replacements like a new roof or HVAC system.
One of the most common rookie mistakes is throwing the mortgage payment (principal and interest) into the operating expense list. The cap rate formula is designed to measure a property's performance independent of its financing.
Because of this, your loan payment must be excluded from operating expenses. This is non-negotiable for an accurate calculation, as it allows you to compare different properties on an apples-to-apples basis, regardless of how they were purchased.
How to Calculate Net Operating Income

Alright, with your financials in order, it’s time to find your Net Operating Income (NOI). Think of NOI as the engine that powers the cap rate formula. It tells you exactly how profitable the property is each year before you factor in any loans or financing.
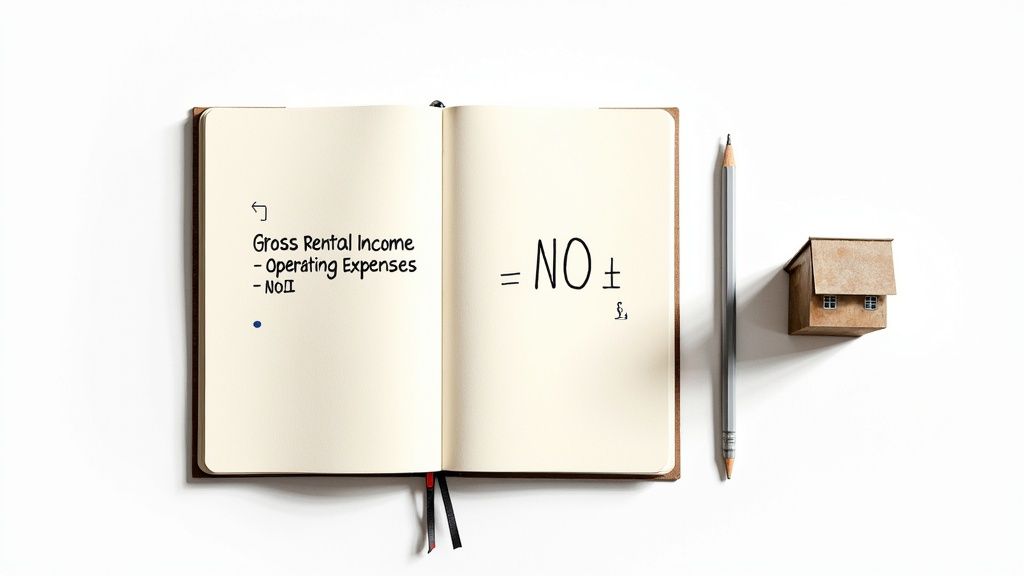
The formula is refreshingly simple: Gross Rental Income - Operating Expenses = NOI.
This calculation isolates the property's day-to-day performance from your personal financing situation. It gives you a clean, unbiased look at its operational health.
A Duplex Calculation Example
Let's put this into practice with a common real-world scenario: a duplex.
Imagine each unit rents for $1,500 a month. You also pull in an extra $50 monthly from a coin-op laundry machine in the basement.
First, let's figure out the Gross Annual Income:
- Monthly Rent: $1,500/unit x 2 units = $3,000
- Monthly Laundry Income: $50
- Total Monthly Gross Income: $3,050
- Total Annual Gross Income: $3,050 x 12 = $36,600
Now for the fun part: subtracting all the real-world operating expenses. To get an accurate number, you have to account for everything—from property taxes down to setting aside money for when a tenant inevitably moves out.
Remember, rental income has tax implications. While the rules vary, many of the same principles for managing taxes when flipping houses can offer useful insights here, too.
A quick word of advice: Never take the seller’s expense sheet as gospel. Always, always do your own digging. It's amazing how often utility costs are understated or repair estimates seem suspiciously optimistic. Diligence here protects you from buying someone else's headache.
Okay, let's subtract the expenses from our $36,600 gross income.
- Property Taxes: $4,500
- Insurance: $1,200
- Property Management: $2,928 (a standard 8% of gross income)
- Repairs & Maintenance Reserve: $3,660 (a prudent 10% of gross income)
- Vacancy Allowance: $1,830 (a conservative 5% of gross income)
- Total Operating Expenses: $14,118
By subtracting our total expenses from our gross income ($36,600 - $14,118), we get our Net Operating Income (NOI) of $22,482.
This is the key figure we’ll carry into the final step to calculate the property’s cap rate.
Putting the Cap Rate Formula into Action

This is where your diligent data gathering pays off. You’ve done the hard work of finding the Net Operating Income (NOI), and now you get to plug it into the formula that unlocks a property's true potential.
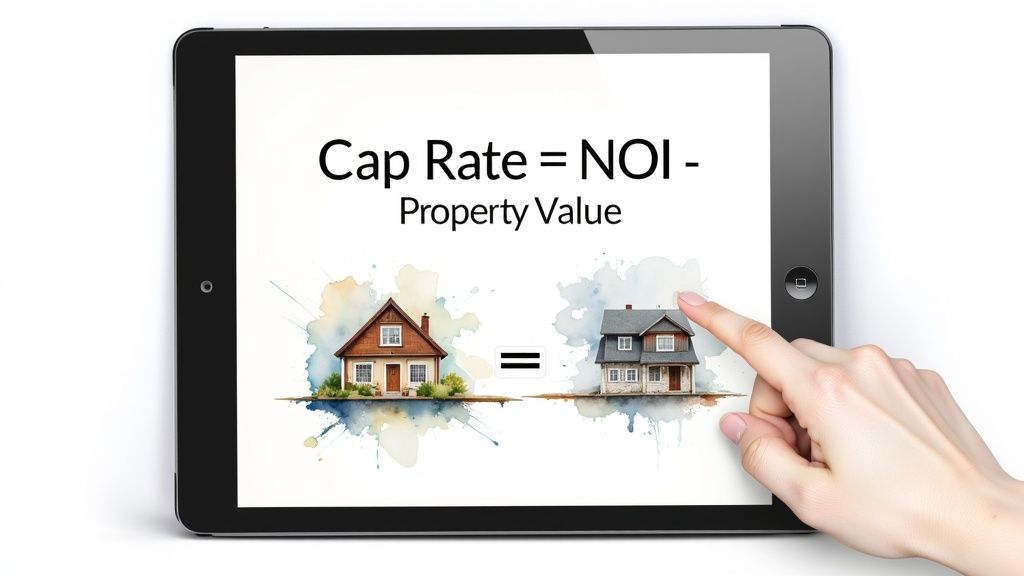
The calculation itself is straightforward: Cap Rate = Net Operating Income / Property Value. Let's run the numbers for that duplex from the last section and see what they tell us.
Calculating the Duplex's Cap Rate
We landed on an NOI of $22,482 for our duplex. Now, let's say the current asking price for this property is $400,000.
Plugging those numbers into the formula:
- Cap Rate = $22,482 / $400,000
- Cap Rate = 0.0562
- Cap Rate = 5.62%
So, the cap rate is 5.62%. What does that actually mean? In simple terms, it’s the annual return you'd pocket if you walked in and paid all cash for the property. No loans, no financing—just a pure measure of the asset's performance.
A single cap rate is a useful starting point, but it's not the whole story. Its true power comes from comparison. You need to stack this number up against other similar properties in the area to understand if you've found a gem, an average deal, or one to walk away from.
Using Cap Rate to Compare Properties
Let's bring a second property into the mix to see this in action. Imagine a similar duplex in a nearby neighborhood is for sale. Its asking price is a little lower at $380,000, but its NOI is also lower—just $19,500—because the units are older and need more maintenance.
Let's calculate its cap rate:
- Cap Rate (Property 2) = $19,500 / $380,000
- Cap Rate (Property 2) = 0.0513
- Cap Rate (Property 2) = 5.13%
Now we have a direct, apples-to-apples comparison.
| Property Metrics | Duplex 1 (Our Example) | Duplex 2 (Comparable) |
|---|---|---|
| Property Value | $400,000 | $380,000 |
| Net Operating Income (NOI) | $22,482 | $19,500 |
| Calculated Cap Rate | 5.62% | 5.13% |
Side-by-side, it's clear. Even though Duplex 2 is cheaper, Duplex 1 offers a better unleveraged return for every dollar you invest. This is exactly why cap rate is so valuable—it forces you to look past the sticker price and focus on the asset's actual financial engine.
Cap rate is a specific tool for analyzing rental properties. To round out your skills, it's also helpful to understand how to calculate Return on Investment (ROI) in a broader context.
Why Market Context Is Crucial for Cap Rates
A cap rate is just a number on a page until you give it a story. This is where seasoned investors really separate themselves from the beginners—they know a property's true potential is never captured by a single percentage.
The same cap rate can signal completely different opportunities depending on where you're looking. Think about it: a 4% cap rate for a building in a booming downtown core, packed with high-income tenants and a surging job market, might be a fantastic, low-risk buy.
On the flip side, you might see an 8% cap rate in a small town with a shrinking population and just one major employer. That's not a bargain; that's a warning sign.
Analyzing the Local Market
To get this right, you have to become a student of the local market. The goal is to figure out what a "good" return actually looks like for that specific neighborhood and that specific type of property.
You need to dig into a few key areas:
- Location: Hyper-local conditions are everything. Is the property near good schools? Is public transportation a block away? Are there major employment hubs nearby?
- Property Class: Assets are usually graded A, B, or C. Class A properties are shiny, new buildings in prime spots. Class C assets are older, need some work, and naturally come with different risk profiles and cap rates.
- Economic Trends: You have to pay attention to the big picture. Are jobs being created? Is the population growing? Are new developments breaking ground? A rising economic tide lifts all boats, and your investment with it.
These regional differences are not subtle. For example, between 2022 and 2023, multifamily cap rates in the Northeast shot up by 112 basis points, while the Midwest saw a more modest 85 basis point increase.
As of Q1 2025, the average U.S. cap rate for a Class A multifamily property sat at 4.84%, while a Class C property could be as high as 6.71%. It’s proof that location and class dictate everything. You can find more data on multifamily cap rates over at butterflymx.com.
Your job as an investor isn't just to hunt for the highest cap rate. It's to find a justified cap rate. You need to understand the story of risk and opportunity that the numbers are telling you before you make a move.
Visualizing this kind of data can be a game-changer. If you want to see how location impacts property values and trends across different areas, it's worth learning how to create a heat map for your target markets.
Field Notes: Common Cap Rate Questions
When you're running the numbers on a new deal, a few common questions always pop up. Here are the quick answers to the things that tend to trip up investors when they're calculating cap rates.
What Is a Good Cap Rate for a Rental Property?
There's no magic number here. A "good" cap rate is completely relative to the market, the property type, and your own appetite for risk.
In a hot urban market where you're banking on appreciation, a 4-5% cap rate might be a great deal. In a slower, cash-flow-focused town, you might not touch anything under 8%. It all depends on the local dynamics.
The real key is to stop looking for a universal number and start comparing apples to apples. What are similar properties in that exact same neighborhood trading for? That’s your benchmark for a fair deal.
Why Isn't the Mortgage Included?
This is a big one. The mortgage is left out on purpose because cap rate measures the property's raw, unfiltered performance. It tells you how the asset itself is generating income, completely separate from how you choose to finance it.
By excluding the debt, you can compare a property you might buy with all cash against another you'd finance heavily on a level playing field. If you want to analyze a deal with financing included, you'd look at a different metric, like Cash-on-Cash Return.
Don't Forget Vacancy: One of the most common mistakes is forgetting to factor in vacancy. It's a real operating expense that eats directly into your NOI. A standard rule of thumb is to budget 5-10% of your gross income for potential lost rent. If you skip this step, you'll end up with a misleadingly high cap rate that makes a deal look much better than it actually is.
Ready to discover the AI tools that are shaping the future of real estate? Explore the curated directory at Tab Tab Labs and find the solutions you need to stay ahead. Visit us at https://tabtablabs.com.